Latest Work
Hello, I am trying something new with my website. I mostly tend to my Flickr gallery at this point, so to reduce the upkeep and redundancy, I am using the Flickr API to pull my latest images straight from my gallery over there. Clicking on any image will simply take you to its page within my Flickr gallery (external link).
A categorical listing of work, separated into albums, is located here (external link).
NGC 1514 Infrared

Data from Proposal 1238: Sparse Spectral Mapping of NGC 1514 (pdf link because I have been unable to find html equivalents for JWST proposals)
Principal Investigator Dr. Michael E. Ressler of JPL (Jet Propulsion Laboratory)
Planetary nebula NGC 1514 in infrared as revealed by JWST. The two outer dusty rings appear in neutral gray while the interior parts of the nebula are deep red. Because it is infrared light, these colors do not have traditional meanings like they might with visible light, but they are still indicative of the elemental composition and temperature of the material cast off by the central star as it ended its hydrogen fusing stage before transitioning to a white dwarf. I don’t personally know how to analyze and determine any specifics, so I’ll leave that to the real astronomers…
Processing notes: Observations do not cover the whole image. Empty areas were filled with approximated texture and random noise to greatly reduce visual distraction. These areas can be easily discerned with minimal scrutiny by zooming in and noting the obviously smooth areas. It’s never my intention to "fake" any part of my images. These areas are merely added for cosmetic purposes. You can also easily see blank areas because they are devoid of stars and background galaxies. In reality, there are very few (if any) places in the sky without one or the other.
Red: MIRI/F2550W
Yellow-Green: MIRI/F1280W
Cyan: MIRI/F770W
North is about 7.42° counter-clockwise from up.
NGC 1514 Visible

Planetary nebula NGC 1514 in visible light from the PanSTARRS survey. Custom stacked and processed to mitigate most of the artifacts that are present in the automatically generated all sky mosaic.
I made this image to compare the incredible difference between the visible light view and the infrared view recently acquired by JWST.
Red: PanSTARRS i
Green: PanSTARRS r
Blue: PanSTARRS g
North is about 7.42° counter-clockwise from up.
Triangulum Hubble Mosaic

Data from the PHATTER survey, Primary Investigator: Julianne Dalcanton.
A color mosaic showing the Triangulum Galaxy. It looks very noisy, but the noise is actually individual stars being resolved. There is a warm yellow core, and cool cyan periphery. The spiral is not strongly defined, but still discernible. Splotches of reddish dust are scattered about. Blue clouds of concentrated star formation are seen mainly in the arms. Many, many clusters of stars and globular clusters speckle the image. A few bright foreground stars from our Milky Way are intruding upon the image, but not so many that they are very distracting. At the edge are some zig zagging boundaries where the edge of the mosaic is. Areas which were empty have been filled with a random noise texture that matches somewhat with the galaxy to greatly reduce visual distraction.
I started working on this years ago, but got stuck at some point just not feeling enough momentum to want to clean up all of the artifacts. Finally got through that last week and finished it up. There’s a maximum image size of 200MB at Flickr, so this is a 40% resize of the mosaic.
I assembled this mosaic manually, but you can actually download already-assembled mosaic files here from the HLSP page:
archive.stsci.edu/hlsp/phatter
A link to a gigapan is available.
Processing note: Around the edges are places where the image is only two filters rather than all four. Where near-infrared F160W had missing data, it was replaced by F814W data. I applied a Gaussian blur to make it more closely resemble the F160W data. Similarly, where F336W data were missing, I filled those areas with F475W. For that I simply adjusted the curves and added some noise to make the blending nicer. Yes, I actually "degraded" the data in both cases to make it look nicer. In my defense that’s way better than faking it, or cutting it off completely.
Red: WFC3/IR F160W
Yellow: ACS/WFC F814W
Cyan: ACS/WFC F475W
Blue: WFC3/UVIS F336W
North is about 75.15° counter-clockwise from up.
V838 Mon Light Echo

This view of the V838 Monocerotis light echo uses color to show the passage of time. As the bright flash of light left the star, it illuminated the dust surrounding it, but because space is so big, we see actually see the light travelling and illuminating the dust as it goes along. Each time Hubble looked at the light echo, it revealed only one layer, like the layers of an onion. Here, I’ve combined multiple layers into a single view, with the innermost one colored red. Next, orange, followed by yellow, green, cyan, blue, and violet. You could say red is the oldest light, and violet is the youngest. The result is a prismatic, rainbow-colored view of the dust cloud.
As a concept, light echoes are at first confusing, because we are not used to light being anything but an instant on or off. It’s my hope that this image makes it a little less confusing, or at least offers one more way to try and understand the light echo. I also wanted to be able to view the dust cloud as a whole and try to make sense of the many flowing, liquidlike patterns within it.
I’ve removed the stars from each layer so that they wouldn’t be too bright in the end result. Then I re-added them on their own isolated layer in white.
Views from March 2002 to September 2006 were used to create this image.
Red: 2002-05-20
Orange: 2002-09-02
Yellow: 2002-10-28
Gray: 2002-12-17
Green: 2004-02-08
Cyan: 2004-10-23
Blue: 2005 Oct, Nov, Dec (Multiple Dates)
Violet: 2006-09-09
(Still need to add observation IDs)
North is up.
Cas A Technicolor Dreamcoat

I’ve done a lot of visualizations of Cas A over the past year plus, and I’m happy to be able to share one. This is one of my favorites! It shows the supernova remnant Cas A in multiwavelength infrared color from JWST, and x-ray from Chandra in cyan. Stars are visible light imagery from Hubble overlaid in their appropriate positions, largely invisible to infrared and x-ray telescopes.
Separated wavelength layers can be viewed at the Chandra website, along with a much more awesome description than I could ever come up with:
chandra.harvard.edu/photo/2024/casa/
There’s also a NASA article!
www.nasa.gov/image-article/nasa-telescopes-chase-down-gre…
North is up.
Southern Ring
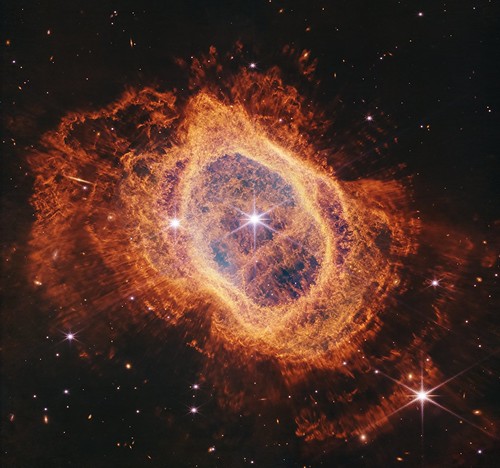
Finally decided to finish up a version of my own for this beautiful planetary nebula. I did a LOT of cleaning up of the banding issues once again using the G’MIC noise debanding filter. I also decided to do something a little different with that central pool of soft but bright, hazy light. I used one of the filters to mostly remove it, revealing the central details more clearly. This leaves the overall image pretty heavy on the red and orange side of things, but I think it looks pretty cool like this.
This was, of course, part of the early release data after JWST was first launched. You can see the official version and learn a lot more about this planetary nebula over yonder: webbtelescope.org/contents/media/images/2022/033/01G70BGT…
Once upon a time, Hubble looked upon this nebula, as well… and I did a version of that, too. flic.kr/p/gJ3NzH
Central subtraction: JWST/NIRCam F405N-F444W
Red-Orange: JWST/NIRCam F444W-470N, F212N
Yellow: JWST/NIRCam F356W
Teal: JWST/NIRCam F187N
Blue: JWST/NIRCam F090W
North is 111.51° clockwise from up.
NGC 6552
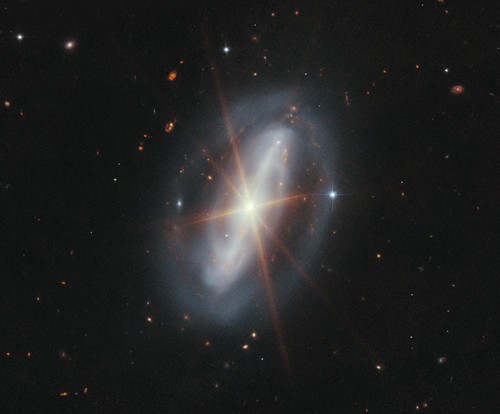
A color composite of JWST commissioning data and some earlier, coincidentally imaged HST data. The nucleus of the galaxy is blatantly active when viewed in infrared with JWST.
Red-orange: JWST/MIRI F560W
Blue-cyan: HST/ACS/WFC F814W
North is 123.96° clockwise from up.
WR 124 (NIRCam)
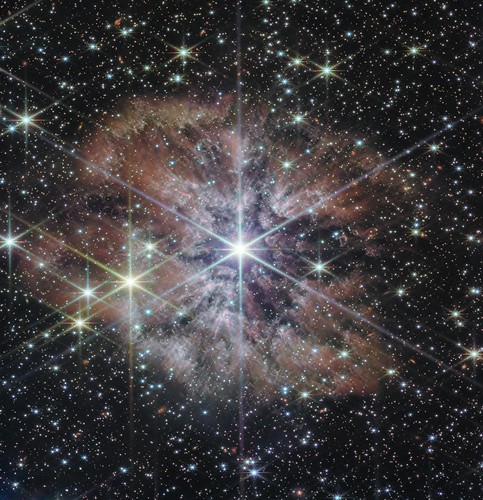
The thing about NIRCam and wideband infrared filters in general is that you get stars. Lots of stars. Even though this nebula is a pretty bright nebula, it has a hard time competing with all the stars. I’ve done the best I could do to show the nebula despite this fact. I think it’s worth zooming in to see the details better, because in the full view, stars are competing too hard with the nebula.
In particular, there are these interesting red "cometary" blobs that seem contained within little hollowed out parts of the bluer part of the nebula. These are very interesting, and difficult to see in any previous views of this nebula, from HST all the way up to JWST’s other camera, the MIRI. I know the nebula is formed by dust created by the star and sculped by winds from the star, but I’m not sure how these red blobs and their hollowed bubbles work out. I might guess that the red blobs are themselves producing some kind of wind force that is hollowing out their own little parts of the nebula. Or perhaps they are collapsing? Anyway, not knowing everything is the fun part about astronomy.
There was a very bright diffraction spike from a star off the lower left of the detector which I spent a long time trying to get rid of. It’s not a perfect solution, and some artifacts may be visible from this. I think it helped a lot to reduce the distraction from this rather annoying line that crossed the whole image.
I made a Behance project showing some of the steps I used to process this image.
Grayscale "screen" for overall brightness: NIRCam F444W
Red: NIRCam F335M
Green: NIRCam F210M
Teal: NIRCam F150W
Blue: NIRCam F090W
North is 40.56° clockwise from up.
WR 124 (MIRI)
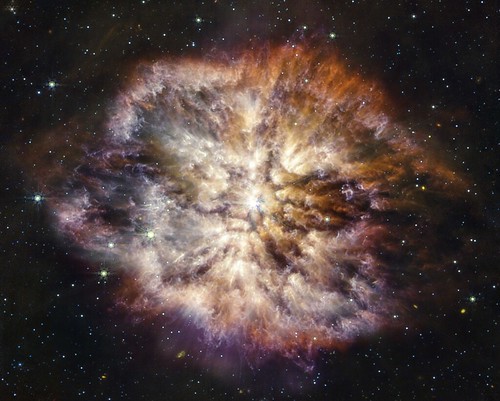
This version of WR 124 is a combination of Hubble and JWST MIRI data. A press release recently featured the same data, and since this is one of my favorite objects, of course I had to have a go at it. The official release from the ERO team was a little bit dark. I also went ahead and used the same G’MIC processing to remove much of the banding noise from the dark parts of the image, allowing me to make it even brighter.
Red: JWST/MIRI F1800W
Yellow: JWST/MIRI F1280W
Yellow-Green: JWST/MIRI F1130W
Cyan: JWST/MIRI F770W
Blue: HST WF/PC2 F656N
North is 40° clockwise from up.
Arp 220
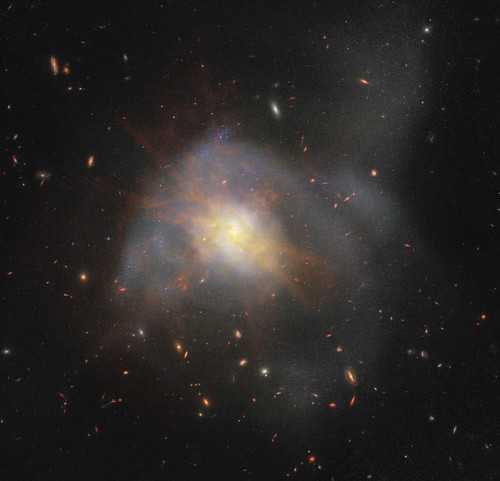
A combination of JWST and HST data showing a new view of ultraluminous infrared galaxy Arp 220. Here, I’ve tried to cut down on the redness because if I were to simply take all the data and throw it together, much of the galaxy would be lost in a red glare. Instead, the central details are actually visible. This is important because the imagery reveals what I presume to be the cores of the two galaxies that merged to create this single disturbed galaxy, not yet fully merged themselves. Prior to JWST observations two cores were already detected, but these new data reveal them in more detail than before.
Surrounding the center are some splotchy red and orange areas representing the MIRI (Mid-Infrared) data. This is essentially glowing dust. That is, the dust emits light in certain mid-infrared wavelengths, revealing it in much greater detail. In visible light, dust requires background illumination to see it or it is otherwise invisible. The eight faint, fuzzy red lines/bars emanating from the center are diffraction spikes caused by support structures of JWST.
Other interesting features include the blue clusters of younger stars resulting from recent star formation brought about when dust and gas collided as the galaxies orbited and merged with one another. Colorful background galaxies were also revealed in JWST data that were previously invisible or below the signal to noise ratio for HST observations. Note that many individual stars and star clusters are visible within the galaxy, thanks to the resolving power of JWST. What may look like noise in this galaxy is actually resolved stars!
Regarding the processing of this image: It took a long time to smooth this out to an aesthetically pleasing image. The shortwave NIRCam imagery is muddled by fine and coarse banding, which makes for a rather unsightly image if not taken care of. I’d like to thank the makers of the open source project G’MIC and specifically Simeon Schmauß for assisting me in greatly reducing and nearly eliminating the banding problems.
Data from the following proposals were used to create this image:
Proposal 2739 (no info as of this post)
An ACS Survey of a Complete Sample of Luminous Infrared Galaxies in the Local Universe
Reddish orange "screen": JWST MIRI F1130W
Red: JWST NIRCam F444W+F356W+F277W
Green: JWST NIRCam F200W+F150W+F090W
Blue: HST F814W+F435W
North is up.


